The latest State of the Commute report shows what many already know: the further from Washington, D.C. you live, the more frustrated you are with the commute.
When it comes to all of those buses, slugging, commuter rail, and Metro choices that allow commuters the option to get out of their car, many surveyed from our area still choose to drive alone.
- The drive-alone rate is 75% for the Outer Ring (Calvert, Charles, Frederick counties in Maryland, and Loudoun, and Prince William counties in Virginia).
- The mode pattern for employment area was similar; fewer than four in ten (38%) commuters who worked in the Inner Core area drove alone, dramatically lower than the drive alone rates for Middle Ring workers (78%) and Outer Ring workers (87%).
What’s keeping those people driving alone? It could be the availability of free places to park.
- The majority of respondents (60%) said their employers offered free, on-site parking to all employees, a slightly lower percentage as had reported free parking in 2016 (64%), 2013 (63%), and 2010 (63%).
- An additional 5% of respondents said their employers did not provide free parking to all employees, but that they personally had free parking.
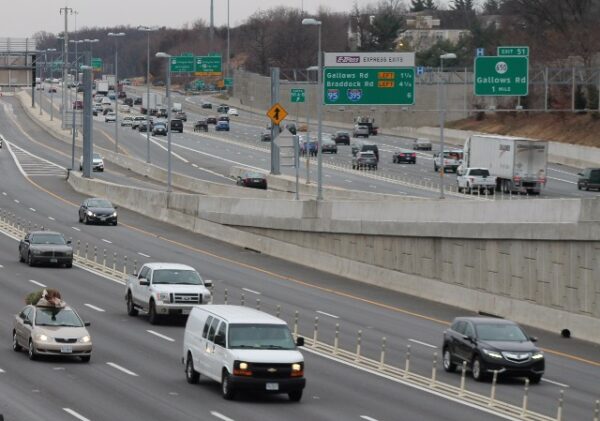
The 2019 average commute distance was 17.1 miles, about the same as the 17.3 miles average measured in the 2016 survey.
- The average 2019 commute time (43 minutes), however, was longer than the times measured in 2016 (39 minutes) and seven minutes longer than the 36-minute average time observed in the 2013 SOC survey.
Commute satisfaction among Metrorail riders, which had fallen dramatically between 2013 (67%) and 2016 (48%), rebounded somewhat in 2019 (56%).
- The 2016 drop likely was related to the SafeTrack trackwork maintenance efforts, which affected both the frequency and reliability of train service.
The percentage of commuters who said their jobs were not compatible with telework dropped, from 51% in 2007 to 34% in 2019.
Because it seems unlikely that the regional composition of jobs changed substantially, these results suggest a shift in commuters’ perception of their ability to perform work away from their primary work location, the survey states.
- This could be related to the increased availability of communication, computer, and networking technology or perhaps from a broader definition of what work was “telework-compatible.”
- Six in ten (60%) teleworkers teleworked under a formal arrangement. This represented a significant shift from 2007, when only 19% of teleworkers had a formal agreement, and a steady increase in formal programs in the years since 2007. This appears to signal a continually growing acceptance of formal telework.
- The largest source of telework information, by far, was “special program at work/employer,” named by 79% of respondents. The percentage increased in 2019, from about seven in ten since the 2010 SOC survey and was considerably higher than in 2007, when only 55% of teleworkers cited their employer as the source of information.
Satisfaction among commuters who drove alone and those who carpooled/vanpooled fell between 2013 and 2019.
- Satisfaction increased among train and bus riders, both of which reported 11 percentage points higher satisfaction in 2019 than in 2016. But 2019 satisfaction among transit riders still was lower than the 58% who were satisfied with these modes in 2013.
Locally, OmniRide’s ridesharing services saw a slight increase in the number of survey respondents that recognized the commuter service.
- Awareness of OmniRide Ridesharing increased to 64 percent in 2019 compared with 51 percent in 2016, and
- Use of OmniRide Ridesharing services increased to 13 percent in 2019 compared with 10 percent in 2016.
The Washington Metropolitan Council of Governments used 7,808 responses from an online survey, and 438 through a follow-up telephone survey, were used to compile the data for this survey.